


The application results pages have all the same structure :
Left menu
  |
  |-- Summary
  |
  |-- Projects
  |     |-- 1st project of the application
  |     |-- 2nd project of the application
  |     `-- ...
  |
  `-- Audits
        |-- Successful
        |-- Failed
        `-- Partially Successful
The cartridge contains :
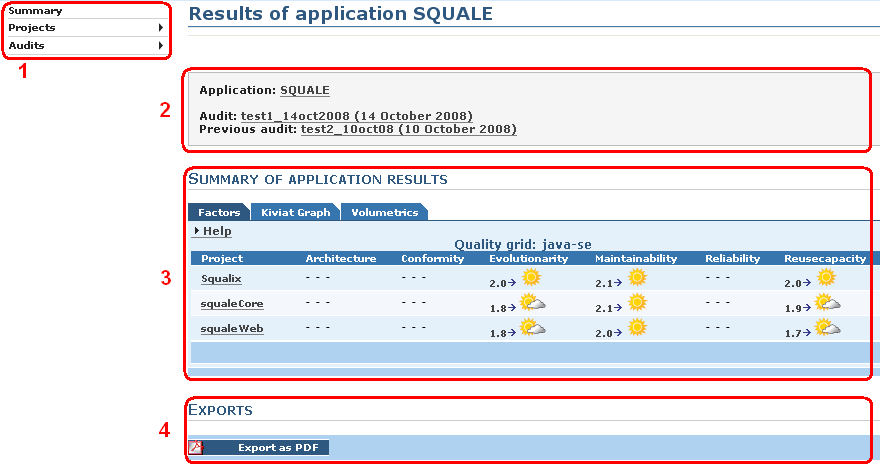
By default Squale compare the mark of the last successful audit with the mark of the next to last successful audit. The dates shown in the cartridge correspond to the dates of the two audits compared. For change the two audits compared see bellow the part the left menu / Audits.
The content of the area 3 depends of the choice done in the left menu.
In this area you will find a button for create a PDF report. This report is a summary of all the informations presents in the area 3.
Bellow you will find a description of the page you will obtain according to the choice done in the left menu.
It's the default choice when you enter in the application results pages. In the area 3 you will find three tabs
In this tab you will find :
By clicking on one of this results / project you will obtain the the associated project results page.
In this tab you will find a kiviat graph which contains a plot for each project.
In this tab you will find a diagram which represent the repartition of line of code for each project of the application.
The sub-menu contains the list of the projects of the application. Click on one of this project and you will obtain the page of results of this project.
In the sub-menu there is three elements that will permit you to manage the audits :
In the area 3 you will find the list of all the successful audits. You can :
In the area 3 you will find the list of all audits failed. You can :
In the area 3 you will find the list of all the partially successful audits. You can :