


All the porject results pages have the same structure :
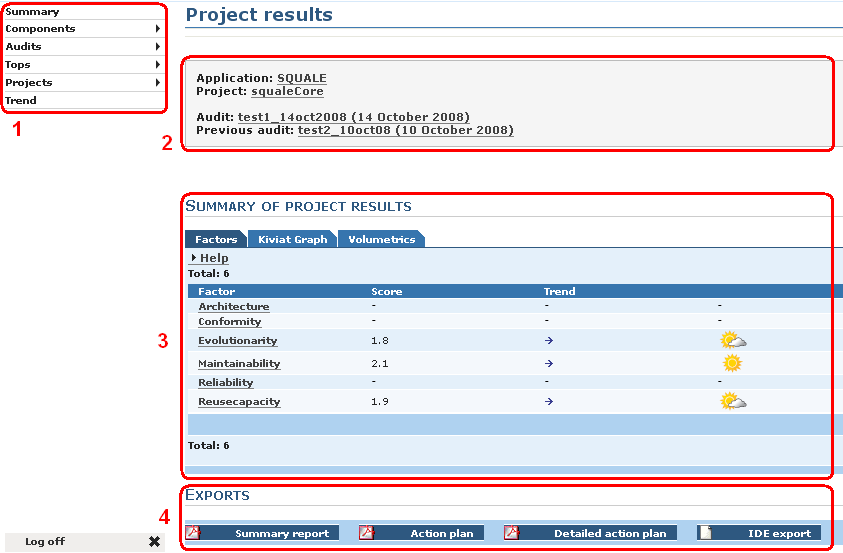
Let's see the contents of these area.
Left menu
  |
  |-- Summary
  |
  |-- Components
  |     |-- All
  |     `-- Excluded from action plan
  |
  |-- Audits
  |     |-- Successful
  |     |-- Failed
  |     `-- Partially Successful
  |
  |-- Top
  |     |-- Method
  |     |     |-- Cyclomatic complexity number
  |     |     `-- Number of source lines
  |     |-- Package
  |     |     |-- Cycles
  |     |     `-- Distance from the main sequence
  |     |-- Class
  |     |     |-- Afferent coupling
  |     |     |-- Couplage between objects
  |     |     |-- Depth of inheritance tree
  |     |     |-- Lack of cohesion in methods
  |     |     |-- Response for a class
  |     |     |-- Number of methods
  |     |     `-- Sum of all cyclomatic complexity
  |     |-- Summary of pratices
  |     `-- Scatterplott
  |
  |-- Projects
  |     |-- 1st project of the application
  |     |-- 2nd project of the application
  |     `-- ...
  |
  `-- Trend
In the cartridge you will find :
By default Squale compare the mark of the last successful audit with the mark of the next to last successful audit. The dates shown here correspond to the dates of the two audits compared. For change the two audits compared see bellow the part : the left menu / Audits
The area 3 displays the results of the audit for the project choose. The content of this area 3 depends of the choice done in the left menu.
In this area you will find buttons for do export in a file (.PDF,.xls). In general this export is a summary of the informations presents in the area 3.
When an audit is partially successful or failed, a link appear between area 2 and 3. By clicking on this link you will obtain of the error happen during the audit.
Here you will find the informations displayed in the area 3 according to the choice done in the Left menu.
In this case we have three tabs in the area 3.
In this tab you will find :
By clicking on one factor you will obtain in the area 3 a new set of tabs. This new set of tabs contains the detailed results of one factor.
In this tab you will find a list of all the criteria which make up the selected factor.
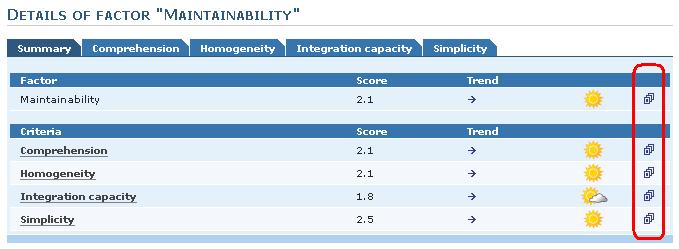
Click on the icon on the right and you will obtain a plot of the score's trend for the corresponding criteria / factor.
By clicking on a criteria you will obtain its corresponding tabs.
In this tabs you will find the list of all the practice which make up the selected criteria.
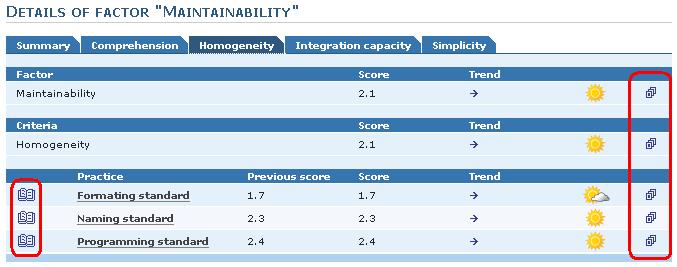
Click on the icon on the right and you will obtain a plot of the score's trend for the corresponding practice / criteria / factor.
Click on the icon on the left and you will obtain a summary on the calculation of the corresponding practice.
By clicking on a practice you will obtain the detail of this practice in the area 3.
You can have two types of presentation for the results of a practice. The presentation obtain depends of the type of practice :

In this page you have the list of the rule transgress order by criticity level. Click on one rule and you will obtain the list of the places where the selected transgression happened.
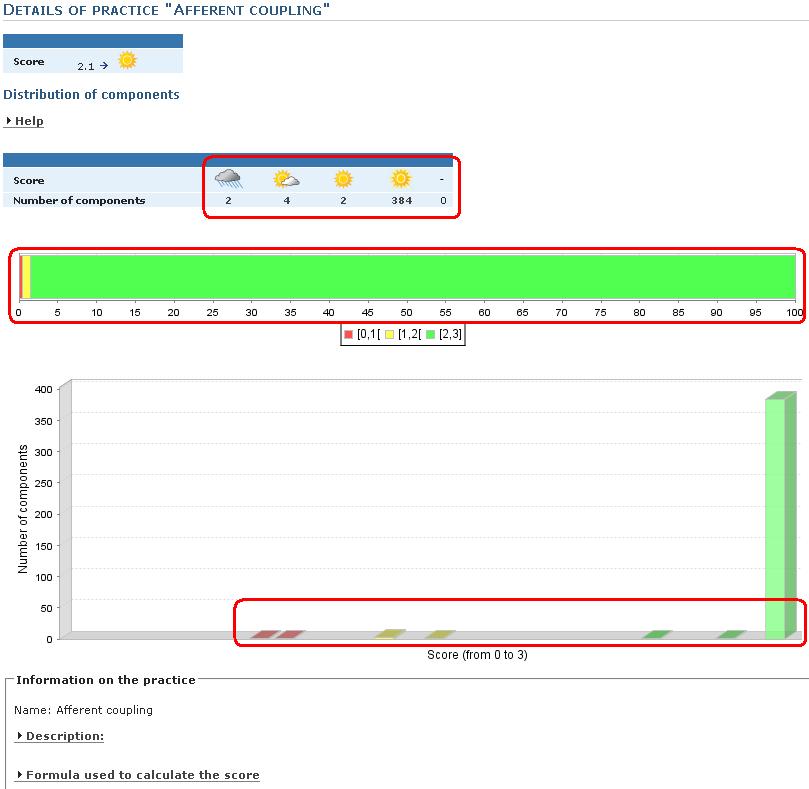
In this page you have some representations of the repartition of the score. Click on an interval, you will obtain the list of the components of the project which score is in this interval. By clicking on one of these components you obtain a summary of the results on this component. More details on this new informations here.
In this tab you will find a kiviat graph which contains a plot for the selected project
In this tab you will find Some global informations on the project :
In addition to the classic summary button, you will find three other buttons :
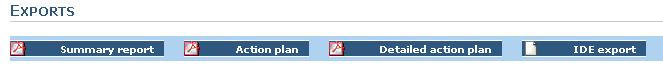
These file give you informations in order to improve your results.
Here in the area 3 you will obtain the results for each component of the project.
When you click on The left menu : components / all, the first component displayed is the top level package.
For each component we have three tabs in the area 3
In this tab you have the list of all the child components of the component selected. Click on one of this child components for obtain its own informations.
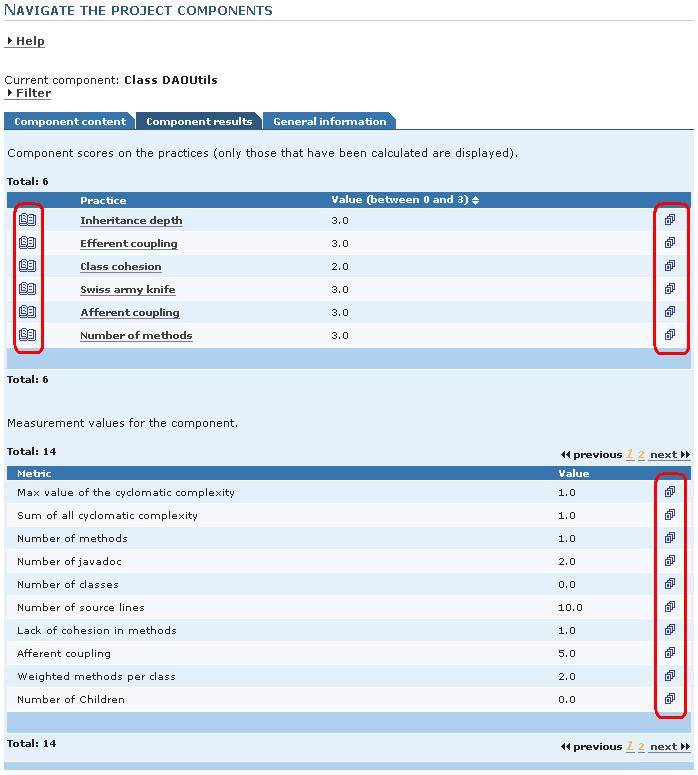
Here you will find the score for each practices and metrics calculate on this component.
Click on the icon on the right and you will obtain a plot of the score's trend for the related practice / metric on this component.
Click on the icon on the left and you will obtain a summary on the calculation on the related practice.
In this tab you can :
Here you will find all the components excluded from the action plan.
In the sub-menu there is three elements that will permit you to manage the audits :
In the area 3 you will find the list of all the successful audits. You can :
In the area 3 you will find the list of all audits failed. You can :
In the area 3 you will find the list of all the partially successful audits. You can :
In the area 3 you will obtain the list of the component and there score for the practice choose sorted in descending order.
Click on one of the component and you will obtain a summary of the results for this component. See here for more informations on this summary
In the area 3 you will find a summary of all the practices calculate sorted by ascending order of score.
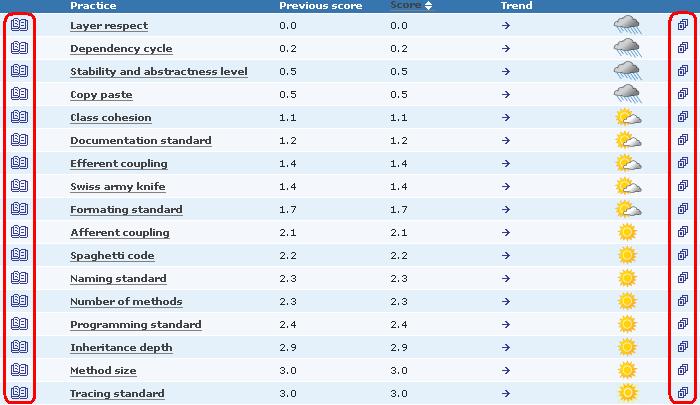
Click on one of the practice and you will obtain the details on the results for this practice.
Click on the icon on the right and you will obtain a plot of the score's trend for the related practice.
Click on the icon on the left and you will obtain a summary on the calculation of the practice.
The scatterplott is draw in the area 3
In the sub-menu you will find the list of the projects of the application. Click on one of this project and you will obtain the page of results of this project.
You obtain in the area 3 the list of the component which have changed between the two audits compared. Use the parameters of this page for, according to your needs, have a more accurate report.